Troubleshooting the ClusterXL Failovers
To identify the root cause of the ClusterXL failovers:In this step, we use several methods to understand what is causing the ClusterXL failovers.
- SmartView Tracker - to filter all ClusterXL messages.
- ClusterXL CLI - to understand the current status of the cluster members and the reason for that.
- Analyze the Syslog messages which were generated at the time of the failovers.
Step 1: Using SmartView Tracker:
To facilitate analysis of what happens at the time of the failover, the relevant messages should be exported to a Text file, after modifying the filter:To export the cluster messages in SmartView Tracker:
- Go to the right-most column "Information"
- Right-click on the name of the column
- Click on "Edit filter"
- Under "Specific" choose "Contains"
- In "Text" type the word "cluster" (do not check any boxes)
- Click on "OK"
- Go to all the empty columns - "Source", "Destination", "Rule", "Curr Rule Number", "Rule Name", "Source Port", "User"
- Right-click on the name of the column
- Click on "Hide Column" (these columns will re-appear after closing and re-opening SmartView Tracker)
- Save all the Cluster messages - go to menu "File" - click on "Export..."
Open the exported file you have just saved, look for the ClusterXL messages during the time of the failover and see if there are messages indicating a problem of one or more critical devices (pnotes).
Examples - if you see problems on:
- "Filter" critical device, most likely the policy was unloaded form that member, which caused the failover.
Investigate and understand why the policy was unloaded form that member. - "Interface Active Check" critical device, it means that on one or more interfaces, CCP traffic was not heard on the specified default time configured. This can be a result of networking issues, high latency, physical interface problems, drivers, etc.
Try to eliminate networking issues, drivers, etc. before you change something in the ClusterXL configurations.
Use the ClusterXL Admin Guide for further help on this topic.
Step 2: Using ClusterXL CLI:
There are several commands that can help us to see the ClusterXL status. The most useful commands while a failover took place, are the following:# cphaprob state# cphaprob -ia list# cphaprob -a if# fw ctl pstat
The following is an example of the output of
cphaprob state from Load Sharing Multicast cluster: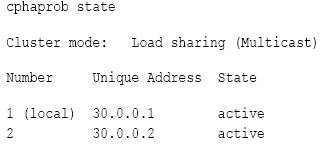
Cluster mode can be:
- Load Sharing (Multicast)
- Load Sharing (Unicast, a.k.a Pivot)
- High Availability New Mode (Primary Up or Active Up)
- High Availability Legacy Mode (Primary Up or Active Up)
- For 3rd-party clustering products: "Service"
In Load Sharing configuration, all members in a fully functioning cluster should be in 'Active' state.
In High Availability configurations, only one member in a properly functioning cluster must be in 'Active' state, and the others must be in the 'Standby' state.
3d-party clustering products show 'Active'. This is because this command only reports the status of the Full Synchronization process. For Nokia VRRP, this command shows the exact state of the Firewall, but not the cluster member (for example, the member may not be working properly, but the state of the Firewall is active).
Explanations on the ClusterXL members' status:
- Active - everything is OK.
- Active Attention - problem has been detected, but the cluster member still forwarding packets, since it is the only machine in the cluster, or there are no active machines in the cluster.
- Down - one of the critical devices is having problems.
- Ready -
- When cluster members have different versions of Check Point Security Gateway, the members with a new version have the ready state and the members with the previous version have the active state.
- Before a cluster member becomes active, it sends a message to the rest of the cluster, and then expects to receive confirmations from the other cluster members agreeing that it will become active. In the period of time before it receives the confirmations, the machine is in the ready state.
- When cluster members in versions R70 and higher have different number of CPU cores and/or different number of CoreXL instances, the member with higher number of CPU cores and/or higher number of CoreXL instances will stay in Ready state, until the configuration is set identical on all members.
- Standby - the member is waiting for an active machine to fail in order to start packet forwarding. Applies only in high availability mode.
- Initializing - the cluster member is booting up, and ClusterXL product is already running, but the Security Gateway is not yet ready.
- ClusterXL inactive or machine is down - Local machine cannot hear anything coming from this cluster member.
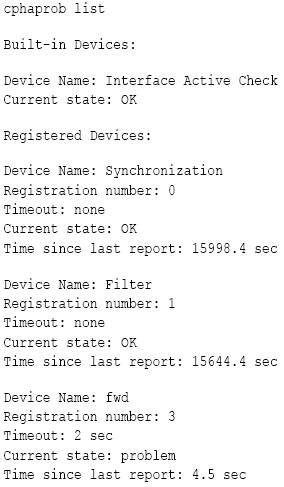
When a critical device (pnote) reports a problem, the cluster member is considered to have failed. Use this command to see the status of the critical devices (pnotes).
There are a number of built-in critical devices, and the administrator can define additional critical devices. The default critical devices are:
- Interface Active Check - monitors the cluster interfaces on the cluster member
- Synchronization - monitors if Full Synchronization completed successfully.
- Filter - monitors if the Security Policy is loaded.
- cphad - monitors the ClusterXL process called 'cphamcset'.
- fwd - monitors the FireWall process called 'fwd'.
For other 3rd-party products, this command produces no output.
Example output shows that the fwd process is down:
 In these cases, check if 'fwd' process is up, using the following commands:
# ps auxw# pidof fwd# cpwd_admin list
Check
$FWDIR/log/fwd.elg file, try to locate the reason why the fwd process crashes.Open a case with Check Point support to keep the investigation.
# cphaprob -a if
Use this command to see state of the cluster interfaces.
The output of this command must be identical to the configuration in the cluster object Topology page.
For example:
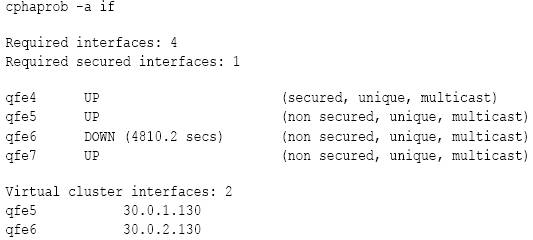
For 3rd-party clustering products, except in the case of Nokia IP Clustering,
cphaprob -a if should always show cluster Virtual IP addresses.When a state of an interface is DOWN, it means that the ClusterXL on the local member is not able to receive and/or to transmit CCP packets withing pre-defined timeouts. This may happen when an interface is malfunctioning, is connected to an incorrect subnet, is unable to pick up Multicast Ethernet packets, CCP packets arrive with delay, and so on. The interface may also be able to receive, but not transmit CCP packets, in which case the status field should be checked. The displayed time is the number of seconds that have elapsed since the interface was last able to receive/transmit a CCP packet.
See: "Defining Disconnected Interfaces" section - in the ClusterXL_Admin_Guide.
# fw ctl pstat
Use this command in order to get FW-1 statistics.
When troubleshooting ClusterXL issues, use this command in order to see the Sync network status and statistics.
At the bottom of this command output, are the Sync network statistics.
If that status is in "off", you will see the 'Synchronization' critical device reporting a problem, when running the
# cphaprob -i list command.That means that the Full Sync in the cluster (when a member is booting up or the cluster is configured) did not succeed.
In these cases, refer to the following SK articles:
Step 3: Analyzing Syslog Messages:
In Linux environment, like SPLAT, go to /var/log/messages files, and search for the time of the failover.In Solaris environments, go to
/var/adm/messages and search for the time of the failover.Look for possible issues that can cause the problem - Link on interfaces going Down, lack of resources like CPU/memory, etc.
When opening Service Request with Check Point support, please attach all these messages to the case, and specify the exact time and date this issue happened, so we can correlate the failover with the logs.
Completing the Procedure
If after following the steps in this guide the failovers are not resolved, open a Service Request with Check Point and provide the following information:- CPinfo files from all cluster members (make sure to use the latest CPinfo utility installed per sk30567)
- CPinfo file from the MGMT server (make sure to use the latest CPinfo utility installed per sk30567)
- /var/log/messages* from ALL the cluster members --- please supply all the messages files in this directory
- $FWDIR/log/fwd.elg* from ALL the cluster members --- please send all the fwd.elg files in this directory
- $CPDIR/log/cpwd.elg* from ALL the cluster members --- please send all the cpwd.elg files in this directory
- An export of all cluster messages from SmartView Tracker (see Step 1 above)
If you need to set custom fail conditions, you can use the cphaprob command. Secureknowledge sk55081 has a good summary of the process for this. You can associate a critical device to some sort of interface or network polling script, and do whatever monitoring you require there.
This is excellent stuff
ReplyDelete