Friday, July 15, 2011

Performance analysis for Security Gateway R65 / R70 / R71 / R75

Good article in Check Point's SecureKnowledge which points out how to analyze the system performance. See sk33781 for details.

The article isn’t only about performance, but also gives good troubleshooting hints and explanations about values and possible errors (especially true for the memory section).

Thursday, July 14, 2011

Cisco Switching Products at different layers


Cisco Systems Inc. supports a broad range of local area network (LAN) switching architecture technologies and platforms.  The general minimal requirements that the Cisco switching platforms are designed to address include the following:
  • High-performance switched Ethernet, capable of delivering 100 Mbps and 1Gbps to the desktop, and 1Gbps or 10Gbps uplinks.
  • Quality of Service (QoS) features permitting prioritization of delay-sensitive traffic and control over packet delay and jitter.
  • Simple, highly structured, and deterministic design (Predictable – in both normal and failure recovery modes).
  • Support for both IP version 4 and IP version 6 protocols.
  • Fault tolerance (Redundancy for critical components and links ‑ eliminating network single-points-of-failure).
  • Flexibility (Network logically partitioned at Layers 2, 3 and 4, to direct traffic flow).
  • Secured through authentication, authorization and accounting (AAA) controls.
  • Modular design capable of supporting new applications and network growth without requiring “fork-lift” upgrades.
  • Scalability for cost-effective delivery of the smallest to the largest telecommunications rooms and campuses
  • Multicast protocol support for end-to-end management and optimization of streaming content delivery.
  • Switches capable of powering IP telephones (via phantom power).
  • Capable of being remotely monitored and managed using network management tools, such as HP Openview.
All Cisco switches are based on a distributed hardware architecture in which the LAN switching functions are separated from the “control plane” functions of switch management by utilizing both one or more general-purpose central processing chips and port or line card application-specific integrated circuits (ASICs).
The general-purpose CPU handles network management functions, like user logins, SNMP, and maintenance operations like operating system booting.  The general-purpose processor controls the configuration of the switch platforms with a command-line interface.  The ASICs optimize packet and frame switching at the port and line card level in order to reduce inter-frame delays and increase overall system throughput.
Older Cisco switches used an operating system called CatOS, with a command-line syntax based on set and clear statements.  Newer switch use an operating system referred to as the Cisco Internetwork Operating System (IOS), which is common across both switching and routing platforms.  The older CatOS is end-of-life and end-of-sale.  Only configurations involving IOS will be shown here.  A newer switching operating system based on the Cisco next-generation Nexus platforms is called NXOS, but is nearly identical to the IOS command syntax, and most of the Cisco switch product is based on IOS.
Cisco switching utilizes recommendations for a hierarchical design in switched network infrastructures, called core, distribution, and access layers.  It is acceptable to combine the functions of the core and distribution layers in smaller switched networks, which is called a collapsed core design.  The functions of each layer are as follows:
Core layer
  • Links to WAN (Internet or other wide-area network)
  • Links to distribution switches
  • Additional Virtual Local Area Networks (VLANs) —Used by the system for routed ports as well as WAN ports
Distribution Layer
  • Server connections
  • Links to downstream (closet) access switches via layer 2 or layer 3 links.
  • Site services, like wireless LAN controllers
  • Service VLANs—To forward traffic to the service modules, such as the client VLAN of a content switch
  • Fault tolerant VLANs—For redundancy with CSM, FWSM, CSS, and so forth
Access Layer
  • Client connectivity at 10/100/1000Mbps

Wednesday, July 13, 2011

Checkpoint VPN Encryption/Decryption behavior

Checkpoint VPN Encryption/Decryption behavior

When the firewall receives a packet, one of the first things it does, before it even goes through the rulebase, is decide whether the packet should be encrypted or not. To do this, the firewall looks at its encryption domain and the encryption domains of all of its peers. It also checks to see if the packet arrived in encrypted form already (i.e., whether it came across a VPN). The decision-making in simplified mode is really straightforward.

If the packet was not encrypted, it makes these checks:


If the source is not in a peer's encryption domain or the destination is not in ours, let it through.(clear text)
If the source is in a peer's encryption domain and the destination is in my encryption domain, then why is it unencrypted? Drop the packet with the message "Received a cleartext packet within an encrypted connection".
If the source is not in my encryption domain or the destination is not in a peer's encryption domain, don't encrypt.

If the source is in my encryption domain and the destination is in a peer's encryption domain, flag the packet to be encrypted to that peer.


If the packet was encrypted, the checks are a bit easier:

If the source is in a peer's encryption domain, and the destination is in mine, decrypt it and let it go about its merry way.

If the source is not in a peer's encryption domain, or the destination is not in my encryption domain, why was it encrypted? Drop the packet with the message "According to the policy the packet should not have been decrypted".

VPN routing makes this a little weirder in that "my" encryption domain and the "peer's" encryption domain can contain the encryption domains of other gateways. Satellite gateways see the hub's encryption domain as containing all encryption domains other than their own.
Note that the decision on whether to encrypt or not happens before any address translation. If you are translating traffic that goes across a VPN, this is why you must have the untranslated address in the encryption domain. You must also have the translated address in the encryption domain because the actual encryption proposals are sent using ranges in the encryption domain.

If you are expecting traffic to go across a VPN, and it is hitting a different rule further down in the rulebase, check your encryption domains. Chances are that the source is missing from yours or the destination is missing from your peer's.

Sunday, July 10, 2011

How to use Linux DD (Data Destroyer) command

Syntax:


dd if= of= bs=skip= seek= conv=


bs = "USUALLY" some power of 2, and usually not less than 512 bytes (ie, 512, 1024, 2048, 4096, 8192, 16384, but can be any reasonable whole integer value.) 


Example:
This command will backup the existing drive


Plug the external drive into the USB port, and boot with The Knoppix live CD. Launch a terminal. :


dd if=/dev/hda of=/dev/sda bs=64k conv=notrunc,noerror


This series will make a DVD backup of hard drive partition:


dd if=/dev/hda3 of=/home/sam/backup_set_1.img bs=1M count=4430 
dd if=/dev/hda3 skip=4430 of=/home/sam/backup_set_2.img bs=1M count=4430  
dd if=/dev/hda3 skip=8860 of=/home/sam/backup_set_3.img bs=1M count=4430


This command will overwrite the drive with zeroes
dd if=/dev/zero of=/dev/sda bs=4k conv=notrunc


Saturday, July 9, 2011

How to use ISO image on SPLAT to upgrade

1- df -h # command to see where you have enough space.

2- mkdir /var/temp/ISO_folder #create folder

3-cp/ftp/scp the CD image to /var/temp/ISO_folder # Transfer the file to the folder

4- mount -t iso9660 -o loop /var/temp/ISO_folder/ISO_file".iso /mnt/cdrom

5- ls /mnt/cdrom. # verify that the ISO_file".iso is listed

6- patch add #to start upgrading

Friday, July 8, 2011

Changing the HA status of the Management station from command line

  1. Run the cpstop command.


  2. To find out the current status, run:

    cpprod_util FwIsActiveManagement

    0 - means Standby.
    1 - means Active.


  3. To set the Management station to Standby status, run:

    cpprod_util FwSetActiveManagement 0


  4. To set the Management station to Active status, run:

    cpprod_util FwSetActiveManagement 1

Tuesday, July 5, 2011

How to troubleshoot failovers in ClusterXL


Troubleshooting the ClusterXL Failovers

To identify the root cause of the ClusterXL failovers:
In this step, we use several methods to understand what is causing the ClusterXL failovers.
  • SmartView Tracker - to filter all ClusterXL messages.
  • ClusterXL CLI - to understand the current status of the cluster members and the reason for that.
  • Analyze the Syslog messages which were generated at the time of the failovers.

Step 1: Using SmartView Tracker:

To facilitate analysis of what happens at the time of the failover, the relevant messages should be exported to a Text file, after modifying the filter:
To export the cluster messages in SmartView Tracker:
  • Go to the right-most column "Information"
  • Right-click on the name of the column
  • Click on "Edit filter"
  • Under "Specific" choose "Contains"
  • In "Text" type the word "cluster" (do not check any boxes)
  • Click on "OK"
  • Go to all the empty columns - "Source", "Destination", "Rule", "Curr Rule Number", "Rule Name", "Source Port", "User"
  • Right-click on the name of the column
  • Click on "Hide Column" (these columns will re-appear after closing and re-opening SmartView Tracker)
  • Save all the Cluster messages - go to menu "File" - click on "Export..."
Troubleshooting Method:
Open the exported file you have just saved, look for the ClusterXL messages during the time of the failover and see if there are messages indicating a problem of one or more critical devices (pnotes).
Examples - if you see problems on:
  • "Filter" critical device, most likely the policy was unloaded form that member, which caused the failover.
    Investigate and understand why the policy was unloaded form that member.
  • "Interface Active Check" critical device, it means that on one or more interfaces, CCP traffic was not heard on the specified default time configured. This can be a result of networking issues, high latency, physical interface problems, drivers, etc.
    Try to eliminate networking issues, drivers, etc. before you change something in the ClusterXL configurations.
    Use the ClusterXL Admin Guide for further help on this topic.

Step 2: Using ClusterXL CLI:

There are several commands that can help us to see the ClusterXL status. The most useful commands while a failover took place, are the following:
  • # cphaprob state
  • # cphaprob -ia list
  • # cphaprob -a if
  • # fw ctl pstat
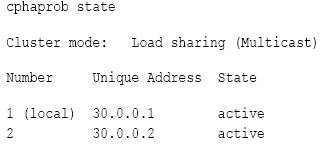
# cphaprob state:
The following is an example of the output of cphaprob state from Load Sharing Multicast cluster:


Cluster mode can be:
  • Load Sharing (Multicast)
  • Load Sharing (Unicast, a.k.a Pivot)
  • High Availability New Mode (Primary Up or Active Up)
  • High Availability Legacy Mode (Primary Up or Active Up)
  • For 3rd-party clustering products: "Service"
The number of the member indicates the Member ID in Load Sharing mode, and the Priority in High Availability mode.
In Load Sharing configuration, all members in a fully functioning cluster should be in 'Active' state.
In High Availability configurations, only one member in a properly functioning cluster must be in 'Active' state, and the others must be in the 'Standby' state.
3d-party clustering products show 'Active'. This is because this command only reports the status of the Full Synchronization process. For Nokia VRRP, this command shows the exact state of the Firewall, but not the cluster member (for example, the member may not be working properly, but the state of the Firewall is active).
Explanations on the ClusterXL members' status:
  • Active - everything is OK.
  • Active Attention - problem has been detected, but the cluster member still forwarding packets, since it is the only machine in the cluster, or there are no active machines in the cluster.
  • Down - one of the critical devices is having problems.
  • Ready -
    • When cluster members have different versions of Check Point Security Gateway, the members with a new version have the ready state and the members with the previous version have the active state.
    • Before a cluster member becomes active, it sends a message to the rest of the cluster, and then expects to receive confirmations from the other cluster members agreeing that it will become active. In the period of time before it receives the confirmations, the machine is in the ready state.
    • When cluster members in versions R70 and higher have different number of CPU cores and/or different number of CoreXL instances, the member with higher number of CPU cores and/or higher number of CoreXL instances will stay in Ready state, until the configuration is set identical on all members.
  • Standby - the member is waiting for an active machine to fail in order to start packet forwarding. Applies only in high availability mode.
  • Initializing - the cluster member is booting up, and ClusterXL product is already running, but the Security Gateway is not yet ready.
  • ClusterXL inactive or machine is down - Local machine cannot hear anything coming from this cluster member.
# cphaprob -ia list
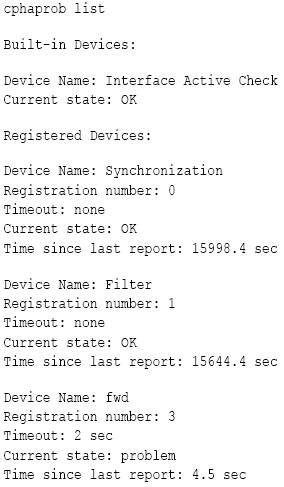
When a critical device (pnote) reports a problem, the cluster member is considered to have failed. Use this command to see the status of the critical devices (pnotes).
There are a number of built-in critical devices, and the administrator can define additional critical devices. The default critical devices are:
  • Interface Active Check - monitors the cluster interfaces on the cluster member
  • Synchronization - monitors if Full Synchronization completed successfully.
  • Filter - monitors if the Security Policy is loaded.
  • cphad - monitors the ClusterXL process called 'cphamcset'.
  • fwd - monitors the FireWall process called 'fwd'.
For Nokia IP Clustering, the output is the same as for ClusterXL Load Sharing.
For other 3rd-party products, this command produces no output.
Example output shows that the fwd process is down:


In these cases, check if 'fwd' process is up, using the following commands:
  • # ps auxw
  • # pidof fwd
  • # cpwd_admin list
If it is not up and running,you need to investigate why.
Check $FWDIR/log/fwd.elg file, try to locate the reason why the fwd process crashes.
Open a case with Check Point support to keep the investigation.
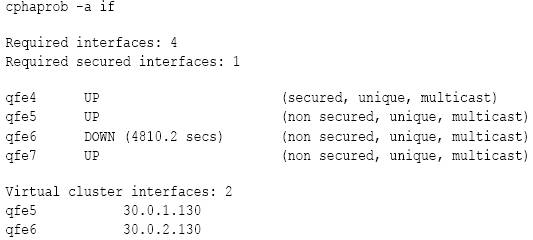
# cphaprob -a if
Use this command to see state of the cluster interfaces.
The output of this command must be identical to the configuration in the cluster object Topology page.
For example:

The state of interfaces is critical to operation of ClusterXL. ClusterXL checks the number of working interfaces at boot and sets a value of 'Required interfaces' to the maximum number of 'good' interfaces seen since the last reboot. If the number of working interfaces changes and becomes less, than the 'Required interfaces', ClusterXL initiates failover from this member to other members. The same applies to 'Required secured interfaces', where only the good synchronization interfaces are counted.
For 3rd-party clustering products, except in the case of Nokia IP Clustering, cphaprob -a if should always show cluster Virtual IP addresses.
When a state of an interface is DOWN, it means that the ClusterXL on the local member is not able to receive and/or to transmit CCP packets withing pre-defined timeouts. This may happen when an interface is malfunctioning, is connected to an incorrect subnet, is unable to pick up Multicast Ethernet packets, CCP packets arrive with delay, and so on. The interface may also be able to receive, but not transmit CCP packets, in which case the status field should be checked. The displayed time is the number of seconds that have elapsed since the interface was last able to receive/transmit a CCP packet.
See: "Defining Disconnected Interfaces" section - in the ClusterXL_Admin_Guide.
# fw ctl pstat
Use this command in order to get FW-1 statistics.
When troubleshooting ClusterXL issues, use this command in order to see the Sync network status and statistics.
At the bottom of this command output, are the Sync network statistics.
If that status is in "off", you will see the 'Synchronization' critical device reporting a problem, when running the # cphaprob -i list command.
That means that the Full Sync in the cluster (when a member is booting up or the cluster is configured) did not succeed.
In these cases, refer to the following SK articles:

Step 3: Analyzing Syslog Messages:

In Linux environment, like SPLAT, go to /var/log/messages files, and search for the time of the failover.
In Solaris environments, go to /var/adm/messages and search for the time of the failover.
Look for possible issues that can cause the problem - Link on interfaces going Down, lack of resources like CPU/memory, etc.
When opening Service Request with Check Point support, please attach all these messages to the case, and specify the exact time and date this issue happened, so we can correlate the failover with the logs.

Completing the Procedure

If after following the steps in this guide the failovers are not resolved, open a Service Request with Check Point and provide the following information:
  • CPinfo files from all cluster members (make sure to use the latest CPinfo utility installed per sk30567)
  • CPinfo file from the MGMT server (make sure to use the latest CPinfo utility installed per sk30567)
  • /var/log/messages* from ALL the cluster members --- please supply all the messages files in this directory
  • $FWDIR/log/fwd.elg* from ALL the cluster members --- please send all the fwd.elg files in this directory
  • $CPDIR/log/cpwd.elg* from ALL the cluster members --- please send all the cpwd.elg files in this directory
  • An export of all cluster messages from SmartView Tracker (see Step 1 above)
If you need to set custom fail conditions, you can use the cphaprob command. Secureknowledge sk55081 has a good summary of the process for this. You can associate a critical device to some sort of interface or network polling script, and do whatever monitoring you require there.